Every question a shopper asks is a datapoint your POS can't see
POS records what was bought. It says nothing about what shoppers asked for, couldn't find, or rejected — that demand evaporates on the floor. ShopVoices turns it into three dashboards for three different readers — store operations, head-office strategy and brand teams — without a single recording or transcript ever leaving the building.
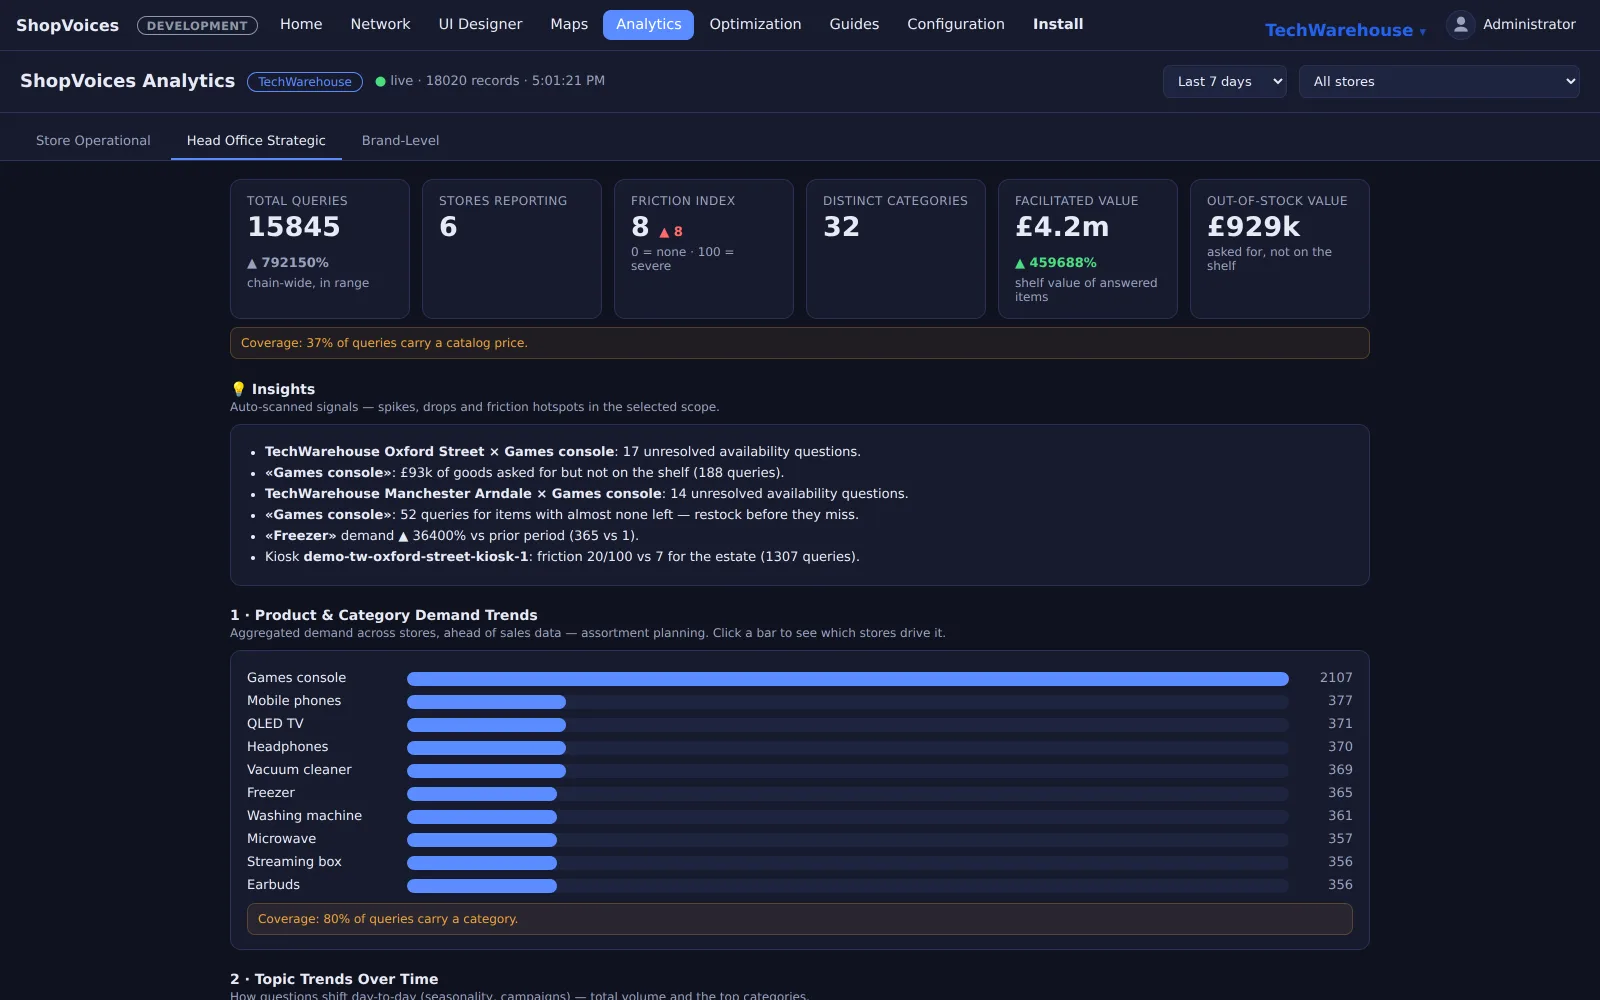
Shelf verification: the stock your systems think is on the shelf — and isn't
POS tells you what sold. ShopVoices tells you what shoppers asked for and didn't find — and ranks it into a Shelf verification queue for every store, so the shelves most likely to be wrong are the ones your team checks first.
The industry context makes this the most valuable list in the building: the landmark academic audit of a US retail chain found 65% of inventory records inaccurate, and a 2025 study of ~24,000 SKUs across 11 grocery stores found that systematic shelf auditing produced an 11% store-wide sales lift — concentrated exactly where the system showed more stock than existed.
Sources: DeHoratius & Raman inventory-record accuracy study; 2025 shelf-audit study (arXiv 2506.05357). A verification queue, not an automatic restock instruction — your team confirms at the shelf.
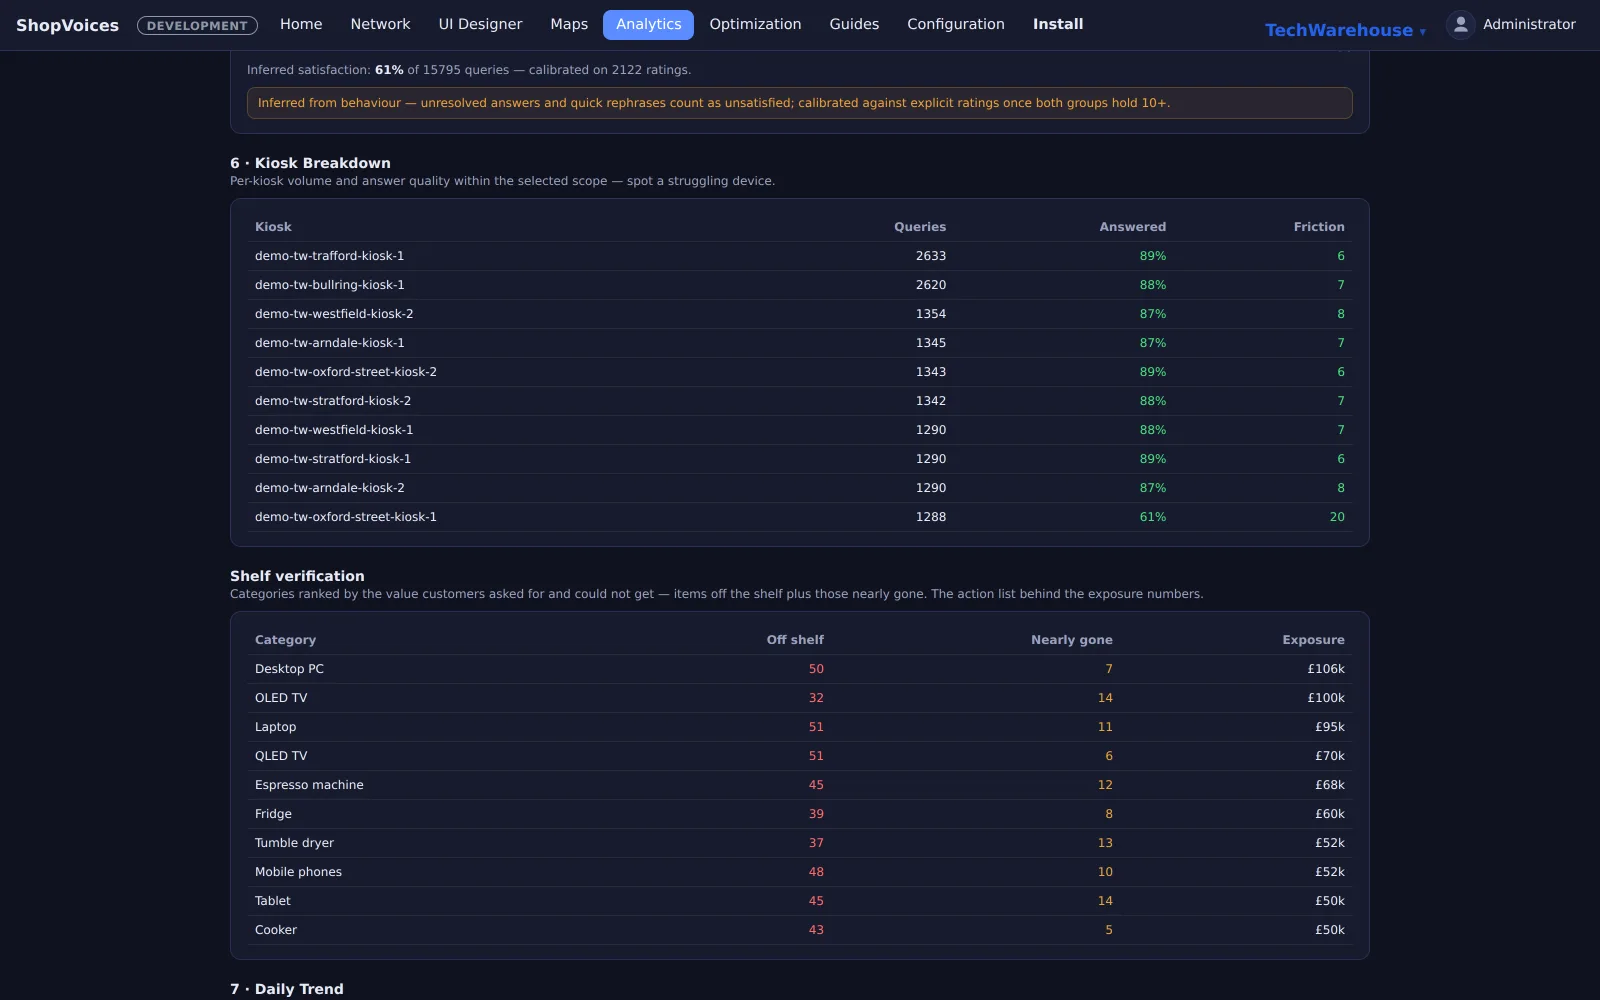
Built for the person reading it, not the database behind it
Store Operational
For the store manager: intent mix, unanswered-question rate, peak interaction times, per-device breakdowns, satisfaction from on-screen 👍/👎 — and the ranked Shelf verification queue built from what shoppers asked for and didn't find.
Head Office Strategic
For the chain: category demand trends, store-vs-store benchmarking with click-through, a Customer Friction Index, and attribute demand — what shoppers ask about, not just what they ask for.
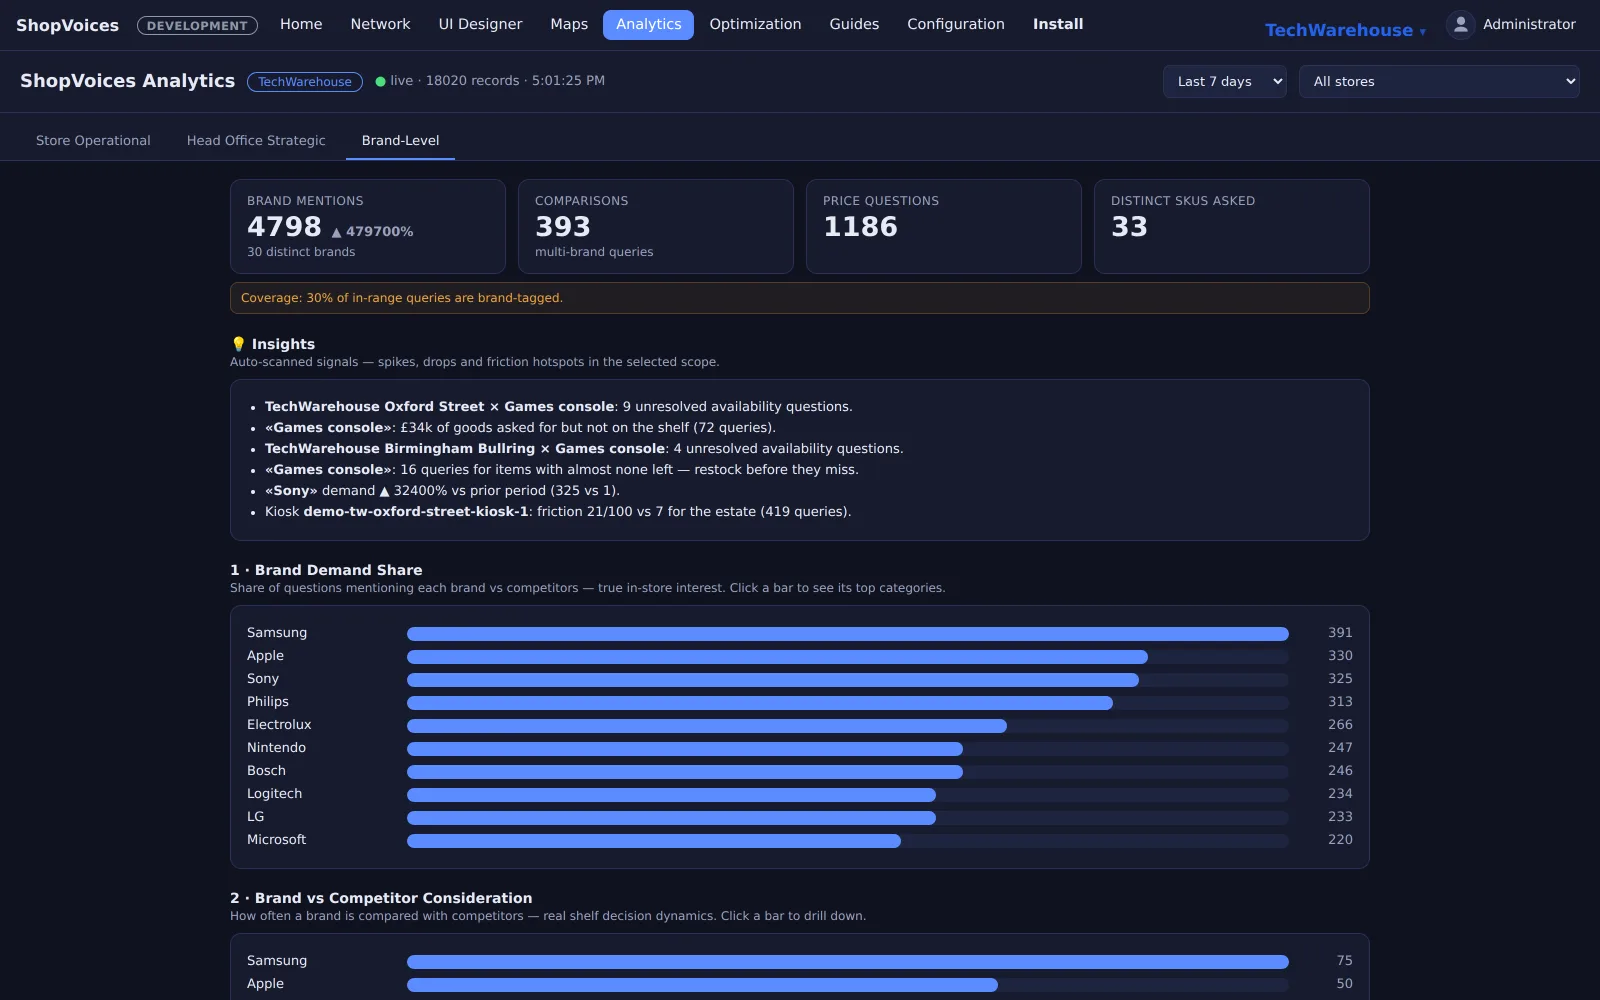
Brand-Level
The retail-media story: what shoppers ask for by brand, and where brand demand meets an empty shelf — spoken in-store demand, collected without retaining audio or transcripts. Depth here is a retailer-controlled configuration, enabled where the applicable legal basis is in place.
Every number opens up — until you're looking at one device on one day
Seven drill-down chains run through the dashboards with breadcrumbs the whole way: category → store → device, brand → product, trend → day. Every figure carries a prior-period delta, and rule-based 💡 insight cards surface the findings worth acting on before anyone goes looking. Regions roll stores up for the managers in between.
- Multi-level drill-downs with breadcrumbs — no dead-end charts.
- Prior-period ▲/▼ deltas on every figure.
- Automatic insight cards that flag what changed and why it matters.
- Interactive at millions of records per store.
Demand data without the data-protection bill
The analytics pipeline ships an allowlist: timings, counts, category tags, a language code, a thumbs-up or -down. Audio never leaves the building, and neither does the transcript — the record structure makes it impossible, not merely forbidden. Richer catalogue-level tags are a retailer-controlled option where the legal basis exists. Every surface feeds the same pipeline, so kiosk, counter, handheld and mobile demand all land in one place.
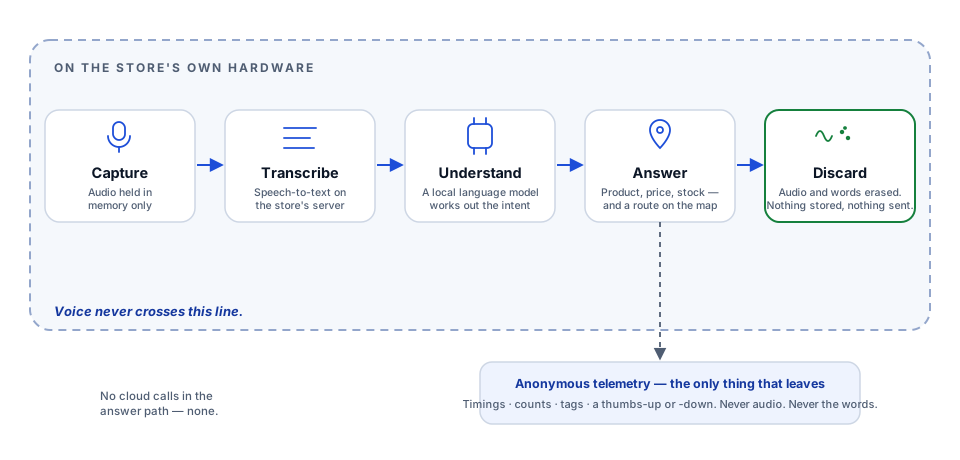
From a spoken question to a merchandising decision
A shopper asks for a product that isn't on the shelf. The question lands in the store's Shelf verification queue within the hour, shows up in the category trend at head office, and moves a brand's stock-friction figure — every step visible in the same tool.
Measure your floor's spoken demand
A pilot ships with the full analytics suite from day one — your stores, your categories, your questions.